If setup pages are the plan, monitoring is the receipt. Keep the receipt.
Monitoring Surfaces
Use the surface that matches the question.| Question | Use |
|---|---|
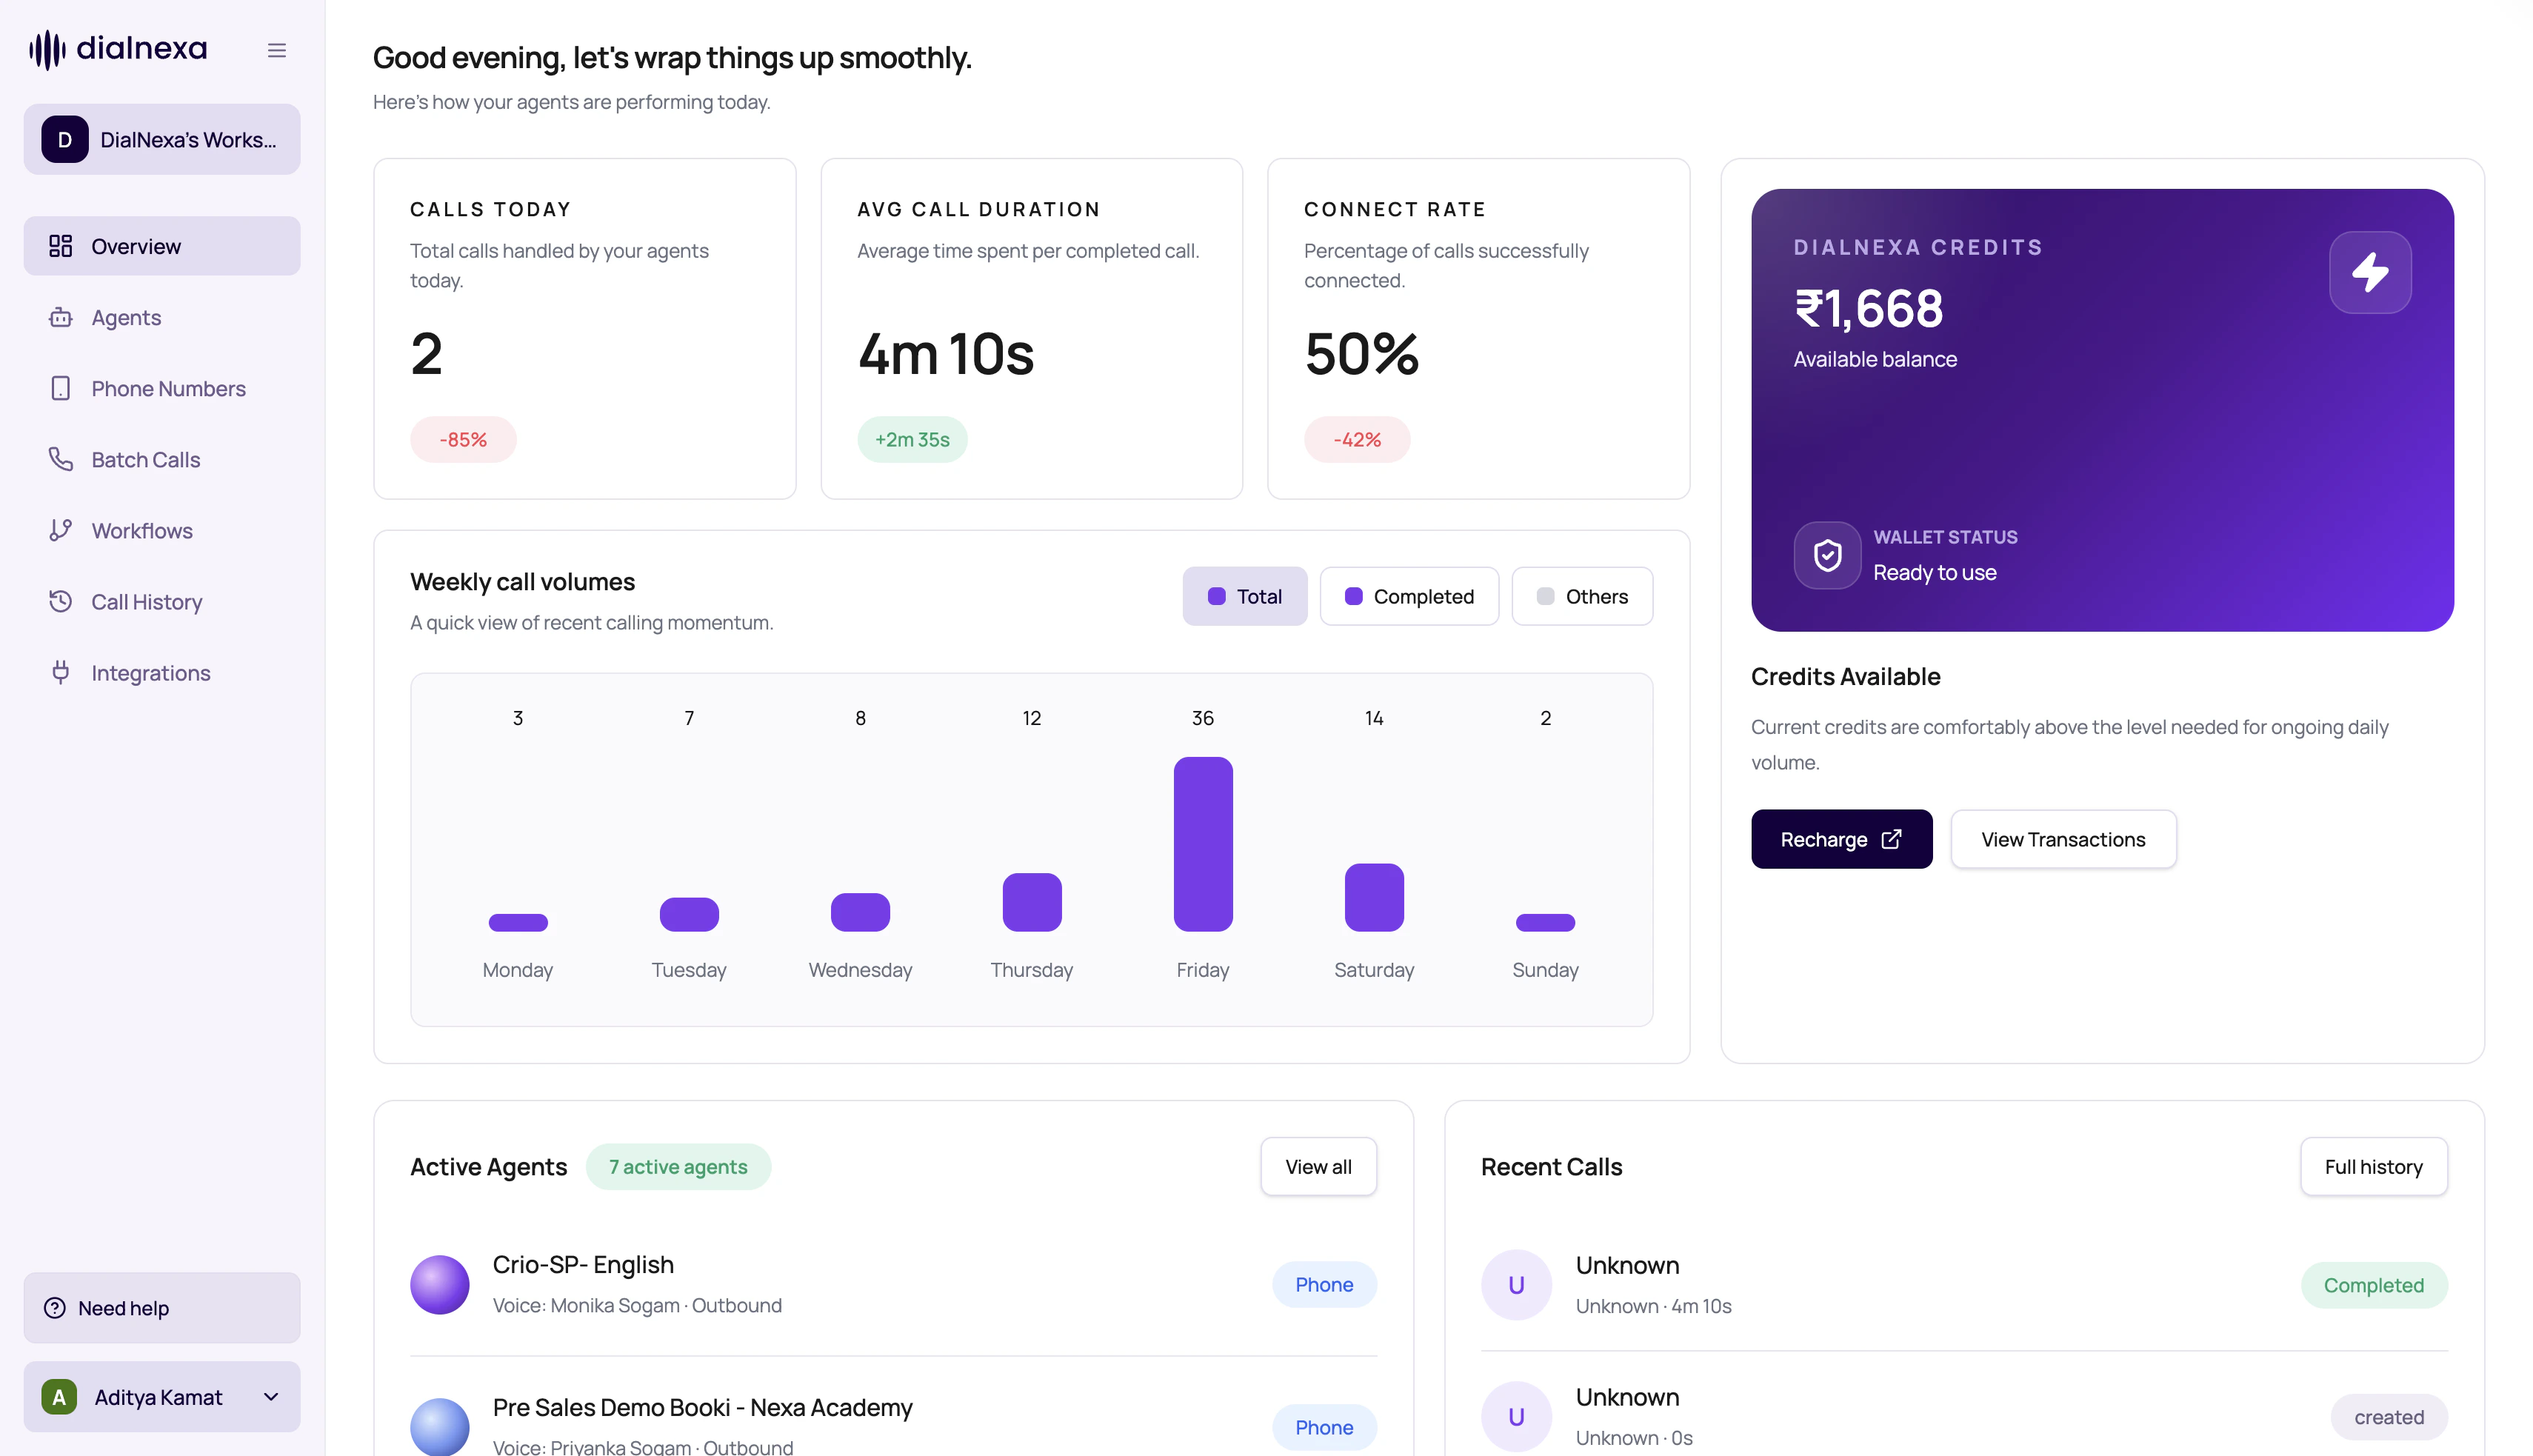
| Which calls happened? | Call History table with filters, date range, sorting, and pagination. |
| What happened in one call? | Call detail page with recording, transcript, summary, and metadata. |
| What did the AI extract? | Post-call analysis results and custom fields. |
| Did retries or transfer happen? | Retry history and transfer detail tabs. |
| Can we report this externally? | CSV exports and webhook delivery evidence. |
Evidence Types
Every evidence type answers a different question.Status
Did the call complete, fail, not pick, cancel, or expire?
Recording
What did the caller and agent sound like?
Transcript
What text did the system capture?
Post-call fields
What structured outcome was extracted?
A Good Debugging Order
Related Reading
Call History
Find calls.
Call Detail Page
Inspect one call.
Exporting Call Data
Report outcomes.